Latest Covid infection rates: Burnley, South Ribble and Blackburn record biggest week-on-week increase in cases as Lancashire declared 'enhanced response area'
and live on Freeview channel 276
The latest figures were revealed as it was announced on Tuesday (June 8, 2021) the county would become an "enhanced response area".
Blackburn with Darwen continues to have the highest rate, with 833 new cases in the seven days to June 4 – the equivalent of 556.5 cases per 100,000 people.
This is up from 436.9 in the seven days to May 28.
Advertisement
Hide AdAdvertisement
Hide Ad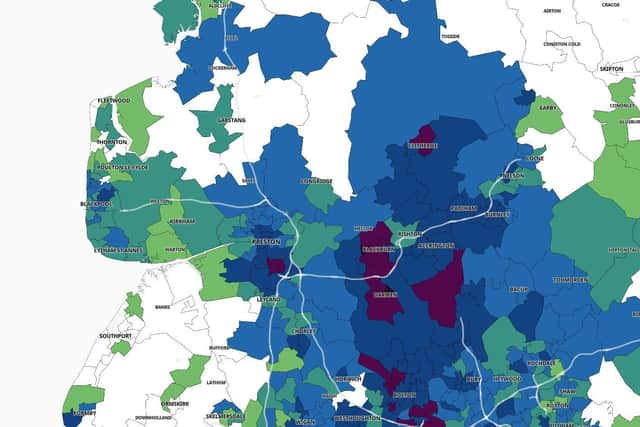

Rossendale has the third highest, down slightly from 316.2 to 310.6, with 222 new cases.
Burnley has risen to fourth in the table after recording 251 new cases, which is a rate of 282.3 per 100,000 people.
Other Lancashire areas also seeing significant increases included, South Ribble, Hyndburn, Ribble Valley and Preston.
The five areas with the biggest week-on-week rises are:
Burnley (up from 120.3 to 282.3)
South Ribble (111.0 to 252.7)
Blackburn with Darwen (436.9 to 556.5)
Stockport (71.6 to 187.1)
Salford (116.3 to 231.8)
Here is the list in full.
From left to right, it reads: name of local authority; rate of new cases in the seven days to June 4; number (in brackets) of new cases recorded in the seven days to June 4; rate of new cases in the seven days to May 28; number (in brackets) of new cases recorded in the seven days to May 28.
Blackburn with Darwen, 556.5, (833), 436.9, (654)
Bolton, 320.3, (921), 381.2, (1096)
Rossendale, 310.6, (222), 316.2, (226)
Burnley, 282.3, (251), 120.3, (107)
Hyndburn, 273.9, (222), 175.2, (142)
South Ribble, 252.7, (280), 111.0, (123)
Ribble Valley, 244.7, (149), 147.8, (90)
Salford, 231.8, (600), 116.3, (301)
Manchester, 224.1, (1239), 111.4, (616)
Preston, 199.8, (286), 120.2, (172)
Bury, 199.0, (380), 115.7, (221)
Stockport, 187.1, (549), 71.6, (210)
Chorley, 157.3, (186), 93.9, (111)
Wigan, 149.4, (491), 79.7, (262)
Rochdale, 143.4, (319), 91.3, (203)
Trafford, 142.8, (339), 69.5, (165)
Bedford, 142.5, (247), 161.6, (280)
Pendle, 142.2, (131), 99.9, (92)
Cheshire East, 105.4, (405), 42.2, (162)
Blackpool, 103.3, (144), 37.3, (52)
Kirklees, 101.4, (446), 117.3, (516)
Tameside, 100.7, (228), 50.8, (115)
Leicester, 98.2, (348), 85.8, (304)
Staffordshire Moorlands, 97.5, (96), 23.4, (23)