New interactive Covid-19 map shows exactly where cases are rising in the Lancaster district
and live on Freeview channel 276
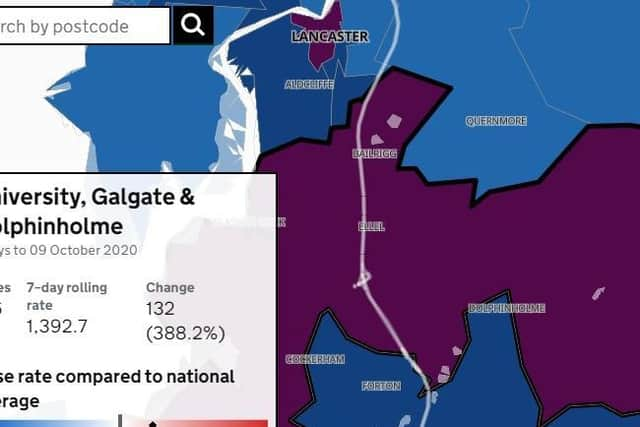
The map for the Lancaster district shows particularly high Covid-19 case levels in the "University, Galgate and Dolphinholme" ward, where there were 166 new cases recorded in a seven day period up to October 9.
It recorded a "seven day rolling rate" of 1,392.7, which is calculated per 100,000 population, an increase of 388.2 per cent on the week before.
Advertisement
Hide AdAdvertisement
Hide AdSo if 100,000 people lived there, 1,392.7 of them would have tested positive for Covid-19.

Lancaster Central recorded the next highest rate, with 40 cases and a seven day rolling rate of 439 - an increase of 73.9 per cent on the week before.
Bare shows a "suppressed" rate, meaning it has not recorded anyone as having Covid-19 in the seven days up to October 9.
Carnforth, Silverdale and Warton has had seven new cases up to October 9, with a 70.8 rolling rate, and no change on the week before.
Advertisement
Hide AdAdvertisement
Hide AdHalton and Caton show 10 new cases up to October 9, and this area pretty much represents the national average.
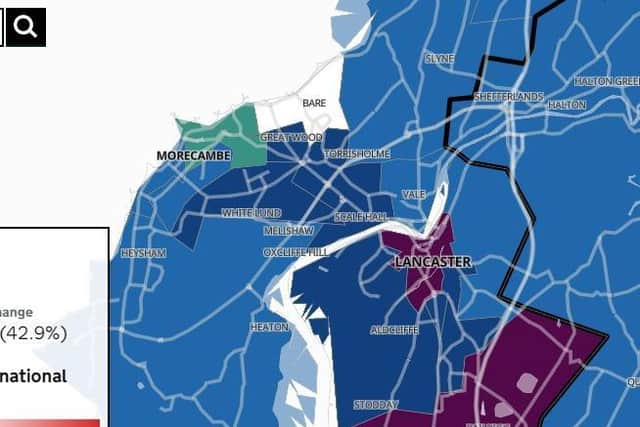
Conversely, Lancaster Central shows figures at just above the national average, although the figures don't take into account an increase in rates between October 9 and now.
Much of Morecambe shows a slightly below average rate compared to the national picture.
The interactive map can be viewed here.The Lancaster district is currently in the government's Tier 2 or "high alert" level of Covid-19 restrictions, and you can find out what that means here.Currently, talks are ongoing over whether Lancashire should be placed in the Tier 3 - or very high alert - level.
Comment Guidelines
National World encourages reader discussion on our stories. User feedback, insights and back-and-forth exchanges add a rich layer of context to reporting. Please review our Community Guidelines before commenting.